Facebook
 X
X
 Pinterest
 Copy Link
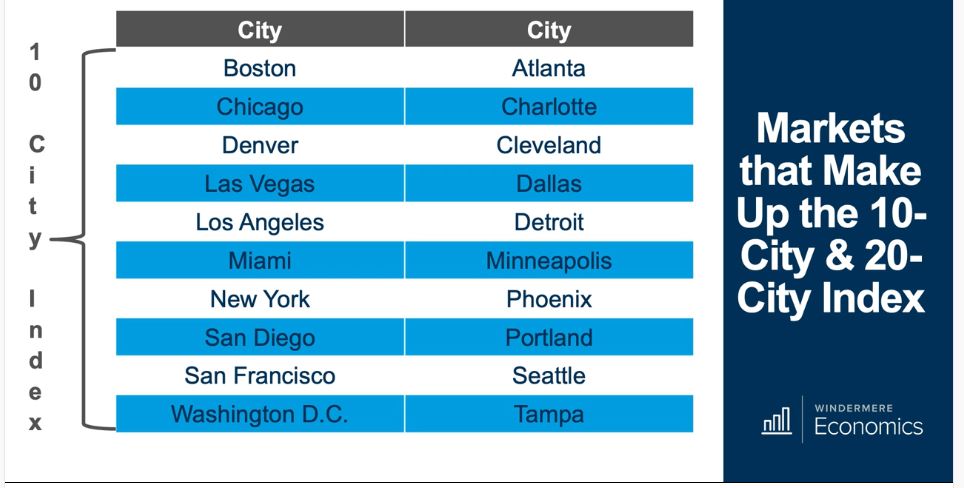
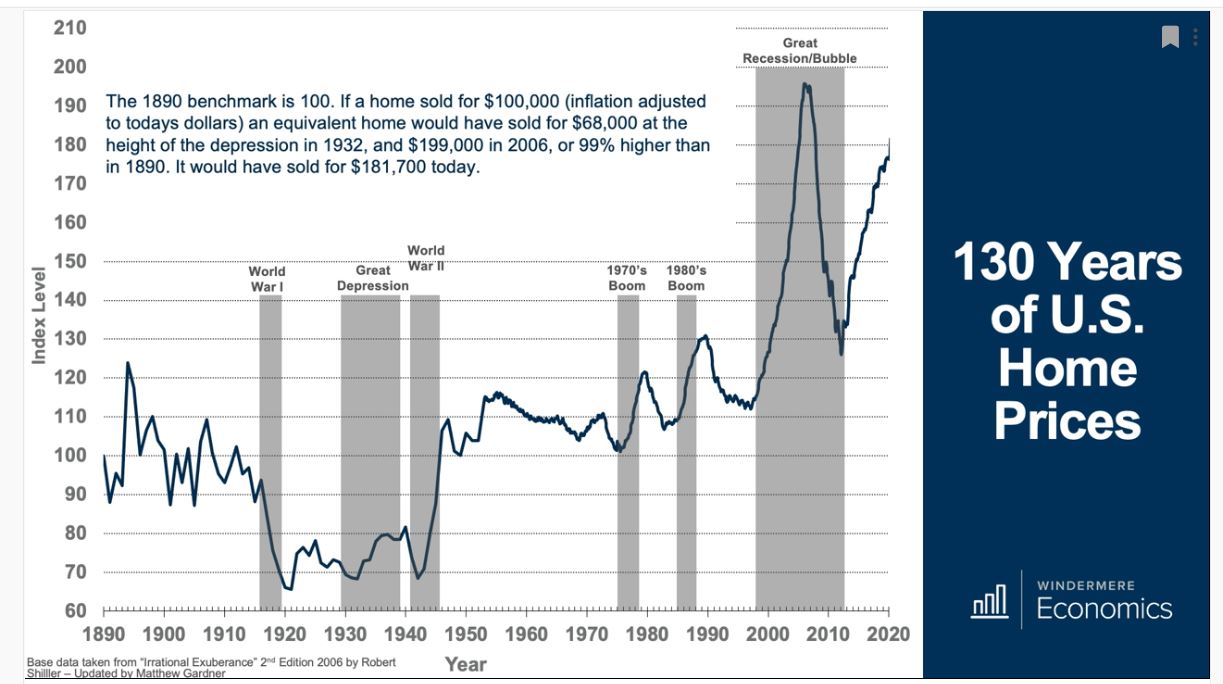
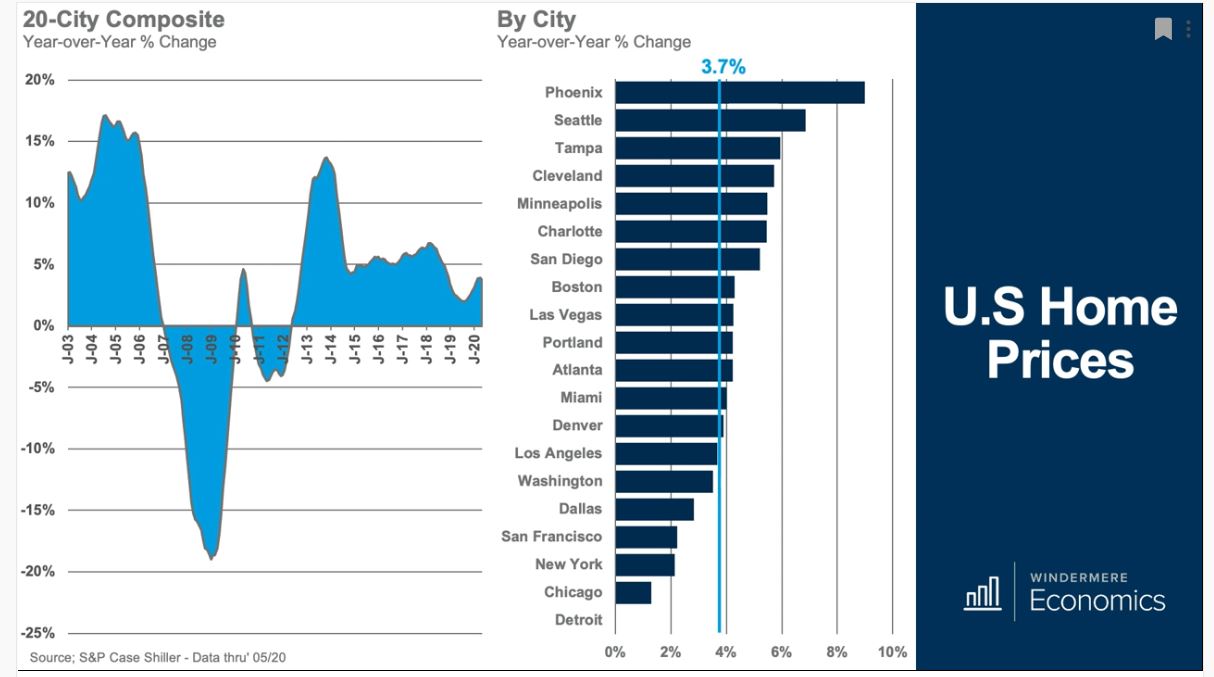
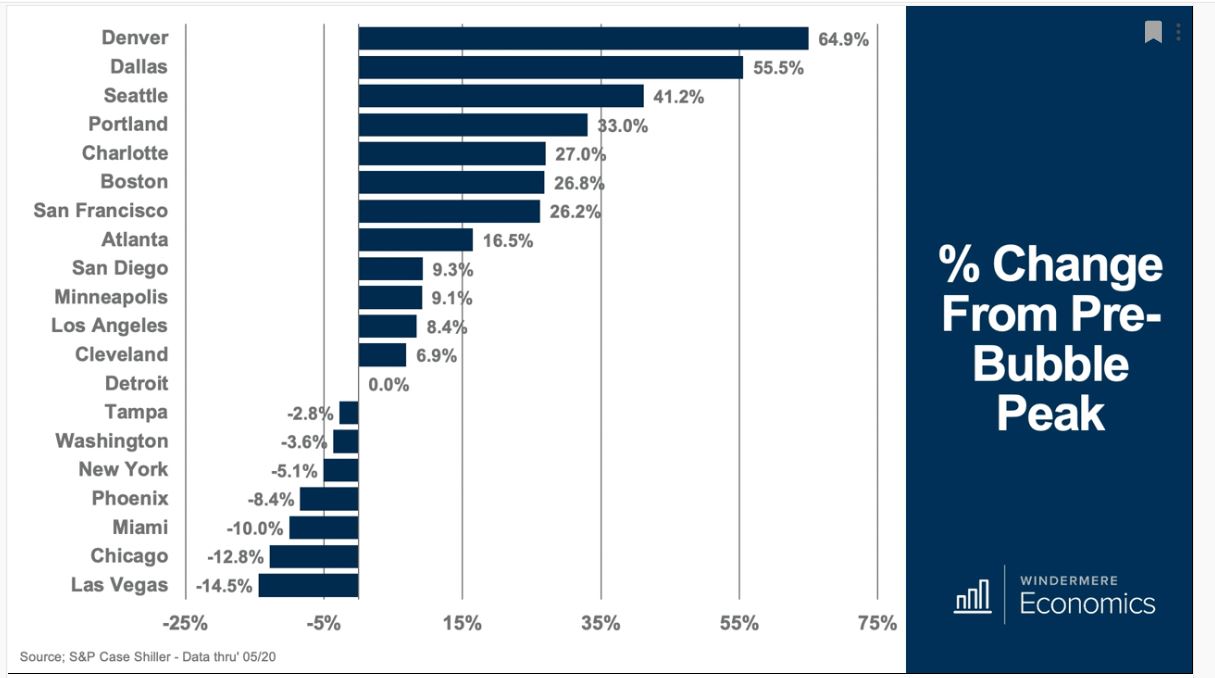
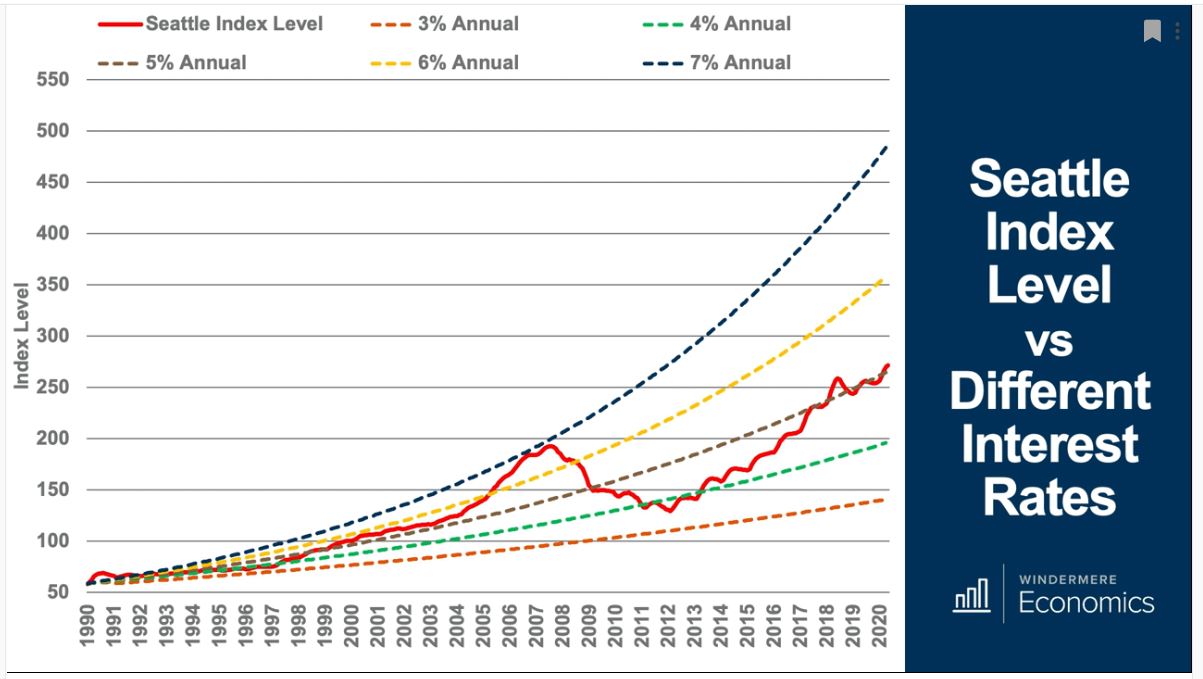
The Case-Shiller Home Price Index is a more accurate measure of house price changes than either average or median house price and looks at changes in the sales prices of individual houses over time. However, The Case-Shiller data is slow. It runs almost 2 months behind and the data is a 3-month moving average so that May data that comes out at the end of July is really the average for March-May a rolling quarterly index.
Based on repeat transactions, single family homes, collected on closed transactions of all residential properties during the months in question. The main variable used for index calculation is the price change between two paired sales of the same single-family home. Home price data are gathered after that information becomes publicly available at local recording offices across the country. Available data usually consist of the address for a particular property, the sale date, the sale price, the type of property and are then combined, using a market-weighted average, to create the Composite of 10 and the Composite of 20. Moreover, each sales pair in each metro area is also allocated to one of three price tiers – low, middle and high – depending on the position of the first price of the pair among all prices occurring during the period of the first sale.